Note
Go to the end to download the full example code.
Plot Vector/Gradient Field
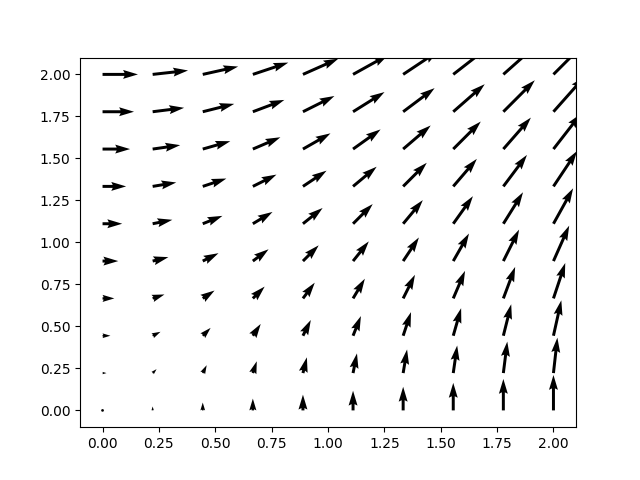
We can plot a 2D vector field by defining a vector-valued function with two arguments
from rbnet.util import plot_vec, plot_grad

def vec(x, y):
    return y, x

plot_vec(vec, 0, 0, 2, 2)
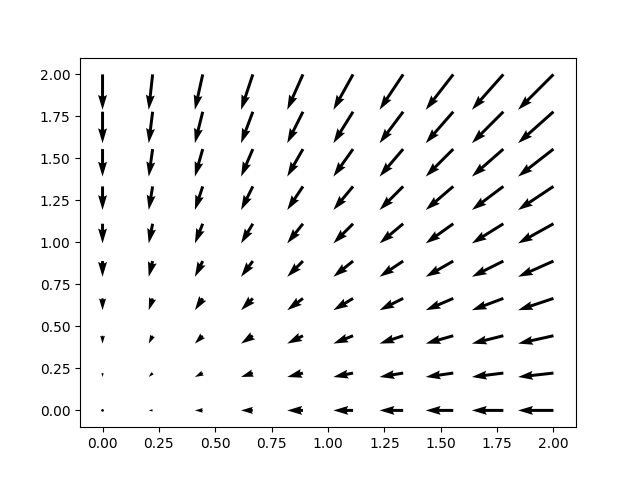
We can plot the gradient of a 2D scalar function
def loss(x, y, eps=1e-12):
    return -(x ** 2 + y ** 2)

plot_grad(loss, 0, 0, 2, 2)
Total running time of the script: (0 minutes 0.127 seconds)